2 min read
Our approach
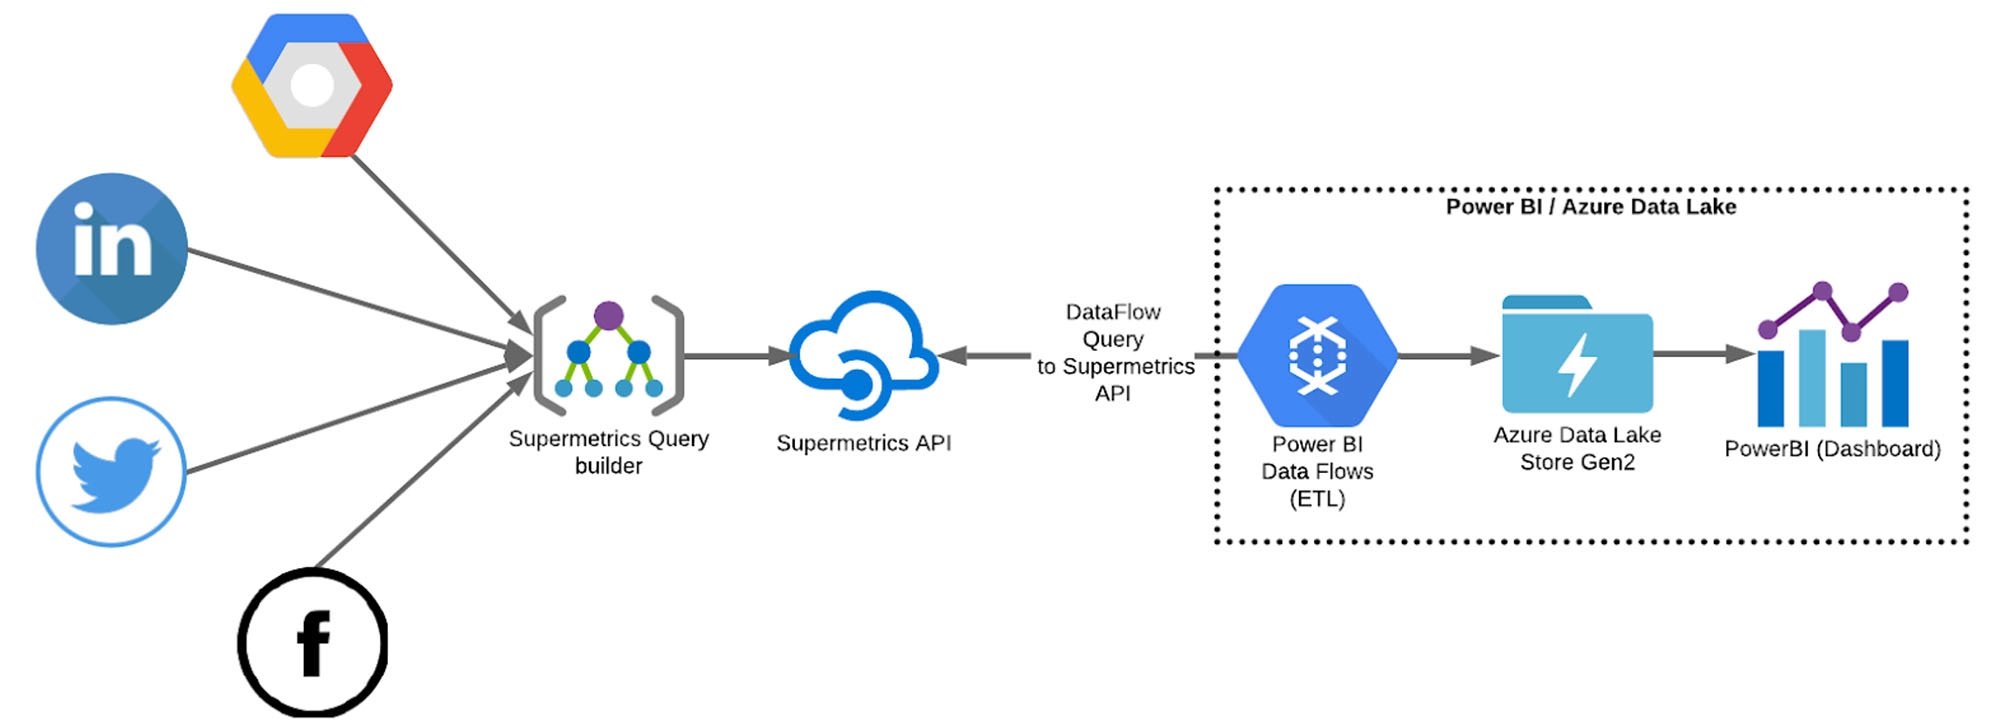
Considering the number of data sources or channels from different APIs, the platform for the dashboard needed to be chosen carefully. We ended up choosing PowerBI as the dashboard platform. PowerBI Data Flows (ETL) and Azure Data Lake were used to store data. To build the data queries, we used the Supermetrics API tool and its query builder. These queries would then be connected to the Azure Data Lake by PowerBI Data Flows.
When the data funnel had been validated, we started gathering data rights from different stakeholders and centralised those rights on key accounts of the city of Helsinki. This was important as we didn’t want to rely on Public APIs from different data sources as they are somewhat restricted.
We built the architecture by building queries with the Supermetrics API tool and dataflows in PowerBI. Dataflow entities allowed us to create automatically refreshing databases, which would then be used in creating the dashboard. Since there was so much data to fetch that queries could take up to a couple of hours, we built a systematic night-time refreshing system to keep the data evenly updated. After this, we had our first minimum viable product ready for comments and feedback.
Finally, we built a finalised dashboard version, focusing on the usability and visual side. The dashboard was approved by the client, and we started our support period, during which we would provide maintenance support for 10 months, and further improvements would be implemented.
Impact
The dashboard we built allows the city of Helsinki to gain insights and a deeper understanding of their hundreds of digital channels. Most importantly, it helps them to compare different channels’ performance. This information can be used to evaluate the importance of each channel and to help with decision-making.
With an understanding of the overview, they can meaningfully dive deeper into more detailed metrics of the dashboard to gain insights into the underlying reasons for performance.
Highlights
- Over 200 different online channels from 6 different APIs combined into a single dashboard
- Helped to further develop a new custom metric, “performance index”
- A better understanding of the performance of each channel
- More holistic view and clarity in comparing different channels
- Ability to compare different pages from different operational branches
- Coordinated data-refreshing architecture to store the data in the cloud